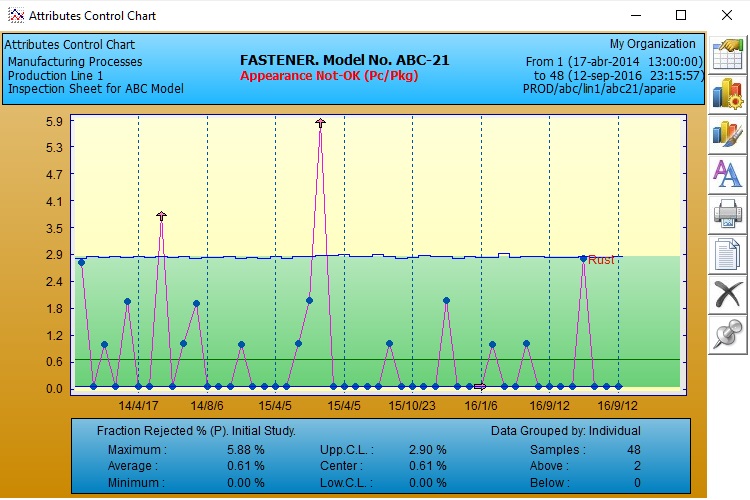
All the attributes control charts can be obtained:
* P chart (defective fraction) * N-P chart (defective)
* C chart (defects) * U chart (defects per unit)
In the graphic section you will have one point
for each sample or for each shift or some other area of opportunity. It is also possible
to insert comments next to the corresponding point.
This is a P-type or defective fraction graph,
in which, as in other attribute graphs, all calculated values are displayed.
|
Control limits can be calculated or fixed values.
As with variable graphs, the horizontal scale is
fully configurable.
Through the button ribbon you can: * Export the graphic
to another application. Reconfigure parameters and scope. * Change colors and fonts * Print the graphic.
|
