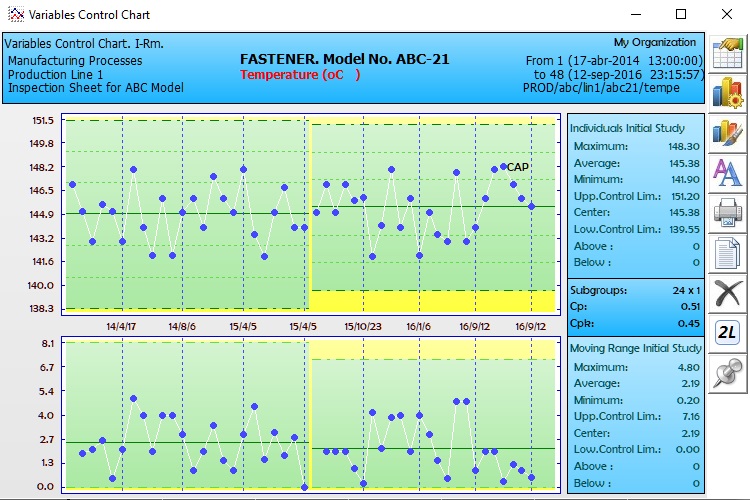
The statistical technique of the Control Chart will
allow you to monitor a stable process to determine when to justify intervening to correct a
probable cause of variation. It is also used to show statistical evidence of the good stability
or control of the process.
You can select between four variants: * X-R or Means and Ranges.
* X-S or Means and Deviations. * PI-Rm or Individuals and Moving Ranges. * EWMA-R or Exponentially Weighted
Moving Averages and Ranges. Any of these can be obtained as an initial study or with pre-established limits.
The automatic header fully identifies the source
of the chart data.
In the graphic section you will have one point for
each sample or for each subgroup. It is also possible to include the comments next to the
corresponding point.
The horizontal scale can be configured to display
the measurement number, date and time, or any characteristics of the sample. The vertical
scale is automatic.
Control and specification limits are shown.
Also the probability zones +/- 1 and 2 sigma.
|
Control multi-limits can be calculated and stored
reflecting changes in the process.
The system clearly presents the calculated values
of the control limits, Average, Range, maximum, minimum, etc.
SuperCEP performs for you the detection of trends
and statistical runs out of control, presenting alarms and warnings with corrective actions.
Through the button ribbon you can: * Export the graphic
to another program. * Reconfigure parameters and scope. * Change colors and fonts. * Print the graph.
Within the configuration options you will vary: * Start and end date.
* Subgroup size. * Type of scales and limits. * Data filter. * Activation of Alarms and Log.
* English, Spanish, Portuguese, Chinese, French or Swedish language.
The great power of SuperCEP is demonstrated with
the option of stratification or filtering of data, through which you can select for analysis
a subset of data that meet a particular criterion. For example, the data of a shift or an operator
or a batch, those that are in a range of values, etc.
|
