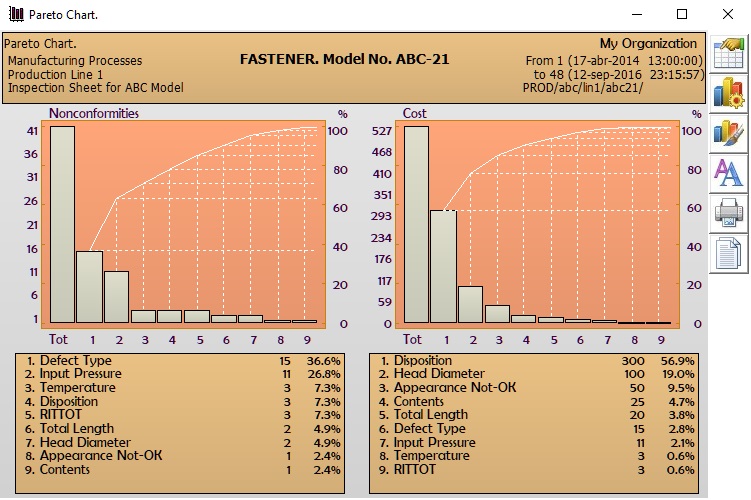
The Pareto chart is a tool that allows you to
rank the importance of quality problems according to the frequency with which they appear
and the cost or relative impact of each one.
They are obtained in 2 ways: * By number of defects.
* By cost of defects.
|
The cost of failure is determined for each characteristic and the relative
order and its impact are clearly indicated.
As in the other SuperCEP charts, you can analyze any period you want.
Furthermore, you can build a Free Pareto, just by capturing the defect code
and the number of defects found.
|
