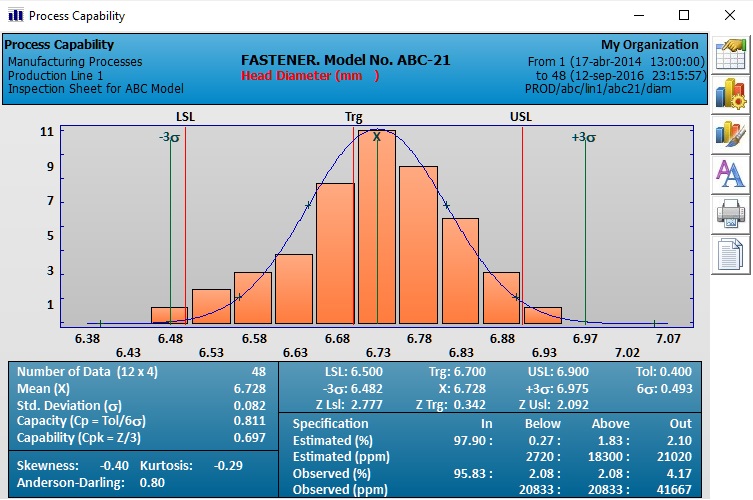
Through the process capacity study, SuperCEP lets you know
how probable it is to meet the specifications and tolerances required by the customer.
This study is based on the statistical theories of the
Normal and Non-Normal frequency distributions.
The automatic header fully identifies the source of
the study data.
In the graphic section you have: * Histogram with frequency
scale and class marks. * Indicators of the mean, standard deviation, target, specification limits and
natural variability 6 sigma zone. * Theoretical Normal curve.
In the numerical section you have: * Mean and Standard
deviation. * Tolerance, Variability and Cp Potential Capacity. * Standard z's and Cpk Process
Capability Index. * Bias, kurtosis and normality fit analysis. * Theoretical and observed nonconforming
population.
|
The system will calculate for you the indices of Capacity
Cp - Cpk, Performance Pp - Ppk and their inverses Cr - Crk and Pr - Prk. Likewise, the Machine Capacity
Cm - Cmk and the Capacity of Taguchi Cpm - Cpmk.
Using the button ribbon you can: * Export the study to another
program. * Reconfigure parameters and scope. * Change colors and fonts. * Print the study..
Within the configuration options you will vary:
* Start and end date. * Number of intervals. * Confidence level from 1 to 6 sigma. * Data filter.
* Normal or Non-Normal Analysis. * English, Spanish, Portuguese, Chinese, French or Swedish language..
A Collective Histogram can also be obtained in which
you will simultaneously analyze all the quality characteristics on a single screen. In this way
it is quickly appreciated which variable or attribute requires the most attention. The Stratified
Histogram displays segmented views to detect variations between shifts, operators, materials, or
any other variable or attribute.
|
